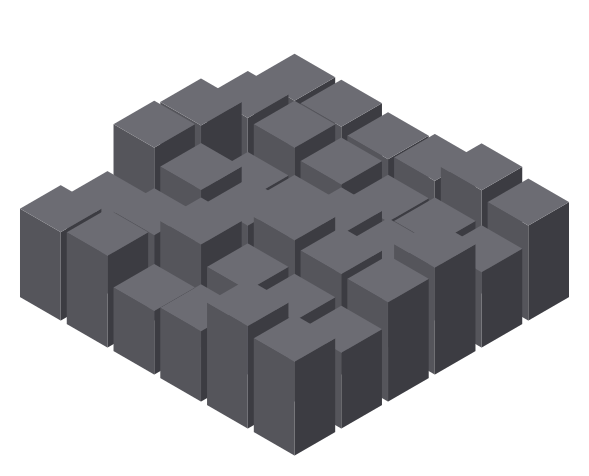
Canonical entities
53,448from 77,210 source recordsCHINA SEMICONDUCTOR NETWORK / RESEARCH · PROCUREMENT · PATENTS
China’s semiconductor network
BlackGrove maps the Chinese semiconductor ecosystem as a set of observed relationships between companies, universities, institutes, and laboratories. Research, procurement, and patent data each capture a different part of that system. Taken together, they allow us to examine where activity is concentrated, which organizations connect otherwise separate groups, and how institutional research links into a wider industrial base.
NETWORK COMPOSITION
Three relationship layers. 53,448 resolved entities.
The current graph contains 240,365 observed relationships across research, procurement, and patents. Source records are resolved to canonical entities without discarding the underlying observations, with evidence retained upstream. The NAURA lite view carries aggregate records but no document-level evidence links.
0100k200k
Research / CoAuthorshipsymmetric co-publication layer
213,265edges · weight 501,561
Procurementbuyer → bidder; agent → buyer; 231,566 source documents
22,520edges · weight 57,726.26
Patent / CoPatenteesymmetric co-assignment layer
4,580edges · weight 17,651
Bar length shows the relative volume of observed relationships in each layer.
NETWORK EXPLORER
Research meets industry.
60 of 3,377 matches · +81 seed/path nodes · 301 ties on this page
Both seeds and connecting paths stay visible. Click to inspect; scroll to zoom.
CAS
NAURA
Shared
Score population: 13,473 entities · combined CAS + NAURA two-hop union. Betweenness: sampled: up to 300 sources per component. Scores stay fixed when filtering.
112 shared entities within CAS 2 / NAURA 2 hops, before other filters. Hops and path context use all relationships, traversed in either direction. Arrows preserve observed direction; filtered-out edges stay hidden. The lite export lacks document-level evidence links. Historical paths do not imply simultaneous supply or control.
Highest weighted pagerank on this page
Aggregate edges
240,365all three observed layersEvidence rows
750,778document/event supportMulti-source entities
2,340entities appearing across sourcesINTERPRETING STRUCTURE
Different layers answer different questions.
Research and patent relationships are treated as symmetric. Procurement keeps the original buyer-to-bidder direction for awards, contracts and candidates; agency runs agent to buyer. SameAs links are used for entity resolution and are never counted as substantive relationships.
Cross-layer participation captures whether the same organization is visible in research, patents, and procurement, while brokerage captures the extent to which an organization connects otherwise less-connected parts of the network. A highly connected institution can be deeply embedded within one community without serving as a bridge between communities. These are different structural positions and are measured separately. Every score is retained with the graph projection, time window, and analytical configuration used to calculate it.
STRUCTURAL MEASURES
rᵢ = α Σⱼ wⱼᵢ rⱼ / Σₖ wⱼₖ + (1−α)/Nout(v) = Σᵤ wᵥᵤ in(v) = Σᵤ wᵤᵥC(v) = 2T(v) / (d(v)(d(v)−1))constraint(v) = Σⱼ (pᵥⱼ + Σ_q pᵥq p_qj)²participation(v) = |{layers containing v}| / |layers|
Weighted PageRank, directed degree, weighted Brandes betweenness, k-core, clustering, Burt constraint, effective size, and layer participation are calculated separately.
METHOD AND LIMITS
How the graph is built.
Sources. The graph combines research collaboration, patent co-assignment, and public procurement records.
Entity resolution. Records that refer to the same organization are resolved to one canonical entity. The source records remain attached for review.
Direction. Procurement is buyer → bidder; agent → buyer. CoAuthorship and CoPatentee are treated as undirected relations.
Neighborhood. The interactive view starts from one seed entity. One-hop nodes connect directly to it. Two-hop nodes are reached through one intermediate entity.
CAS TWO-HOP SAMPLE / SOURCE-EXPORT ANALYSIS
A two-hop view from the Chinese Academy of Sciences.
This view starts with the Chinese Academy of Sciences and follows the network outward for two steps. It contains 120 canonical entities: the seed, 60 direct connections, and 59 entities reached through those first-hop organizations. The bounded neighborhood preserves the institutional context around CAS while showing where its research network begins to intersect with buyers, bidders, patent applicants, and industrial companies.
The core is overwhelmingly research-driven.
Research collaboration accounts for 1,988 of the 2,205 relationships in this neighborhood. The Chinese Academy of Sciences has 70 direct ties here, all of them co-authorship relationships, including strong connections to the University of Chinese Academy of Sciences, the Institute of Semiconductors, the Institute of Microelectronics, and the Shanghai Institute of Microsystem and Information Technology. The immediate structure is institutional and research-heavy. CAS sits inside a dense set of specialist organizations rather than connecting evenly across the wider semiconductor economy.
Procurement sits around the research core.
The seed has no direct procurement relationship in this view. The 185 observed buyer-to-bidder relationships appear among organizations one and two steps away. CAS occupies a research-centered position, while procurement activity emerges around the organizations connected to it. Research institutions and purchasing organizations therefore occupy different positions within the same ecosystem, with the connection between them becoming clearer as the network moves outward from the research core.
A small number of organizations carry most of the brokerage.
Only 45 of the 120 entities have non-zero betweenness in the combined projection. The highest values belong to the Chinese Academy of Sciences, the Institute of Microelectronics, Peking University, Nanjing University, and BOE Technology Group. A disproportionate share of efficient paths in the neighborhood pass through this small group. Betweenness identifies brokerage within the observed network; it does not by itself measure organizational capability, size, or influence.
Many of the main bridge organizations appear in all three layers.
Forty of the 60 first-hop entities appear in more than one relationship layer, and 22 appear in all three. The Institute of Microelectronics, Peking University, Nanjing University, Zhejiang University, Fudan University, and Xidian University combine research, procurement, and patent activity with comparatively high brokerage scores. These organizations occupy more than one institutional role at once. They appear across multiple layers while also connecting parts of the network that are less directly connected to one another.
The neighborhood is dense, but its bridges are less redundant.
Median clustering in the combined network is 0.84, indicating a strongly interconnected local structure. The leading brokers also tend to have lower Burt constraint and larger effective size, meaning their contacts overlap less with one another. Dense local connectivity and brokerage are not the same thing. Some organizations are deeply embedded within tightly connected communities, while others connect groups with fewer alternative paths between them. Those bridge positions can be consequential even when the organizations themselves are not the largest or most densely connected nodes in the graph.
The second hop is where the industrial footprint expands.
The 59 second-hop entities add buyers, bidders, patent applicants, and industrial organizations that do not connect directly to the seed. Their average PageRank and betweenness are lower in this bounded view, in part because of how the neighborhood is constructed. This is also where the network begins to move beyond CAS's immediate institutional research environment and into a wider set of industrial and technical actors.
WHAT THIS MEANS FOR THE SEMICONDUCTOR INDUSTRY
Semiconductor capability does not move through a single supply chain.
Semiconductor development in China does not appear here as a simple progression from research institute, to manufacturer, to customer. Research, procurement, and patent relationships form overlapping systems, and different organizations occupy different positions within each of them. Technical capability can therefore develop in one part of the network before becoming visible in another.
The CAS neighborhood shows this clearly. Its immediate structure is dominated by research relationships, while procurement and patent activity become more prominent further from the seed. Expertise and technical work are concentrated inside a dense institutional research environment, but the organizations surrounding that environment connect it to buyers, suppliers, patent holders, bidders, and industrial firms. The movement from research into production is therefore unlikely to be captured by following a single institutional chain.
Some of the most revealing organizations are the ones that appear across several layers. An institute may collaborate on research, share patent activity with another organization, and sit close to a procurement relationship without itself being a major buyer or supplier. Those combinations show where technical knowledge, industrial demand, and production capacity come into contact.
They also create less obvious forms of exposure.
A commercial supplier does not need a direct relationship with the Chinese Academy of Sciences, a major state laboratory, or another sensitive institution to sit inside the same industrial system. It may instead be connected through a customer, university laboratory, joint patent applicant, bidder, contractor, or second-order supplier. Examined individually, each relationship may appear routine. Reconstructed as a network, the same relationships can place a firm much closer to a research or industrial cluster than its immediate counterparty suggests.
The same applies to upstream dependency. A company may understand who it purchases from while having much less visibility into the research institutions, patent relationships, specialist suppliers, or downstream customers connected to that supplier. The relevant unit of analysis is therefore not only the firm or transaction. It is the firm's position within the wider network through which technical knowledge, demand, components, equipment, and industrial capacity circulate.
This does not mean that every indirect connection represents technology transfer, control, or material dependency. A co-authorship relationship is not evidence of procurement, and proximity in a network is not evidence that technology moved between two organizations. What the graph provides is a way to identify the pathways along which those relationships could develop and to distinguish ordinary proximity from repeated structural overlap.
The strongest cases are likely to be those that persist across layers and across time. Where the same organizations repeatedly connect research, patents, and procurement, and continue to occupy bridge positions under different network specifications, there is a stronger basis for examining how capability is being developed, commercialized, and distributed through the semiconductor ecosystem.
Conventional supplier lists capture immediate counterparties but miss much of this structure. Situating firms within the surrounding research, procurement, and patent networks makes indirect dependencies visible and shows where exposure can arise through organizations that would otherwise appear peripheral to the relationship being examined.